Sunday, March 4, 2018

Weekly Blog 3/4/18 - Sound

https://upload.wikimedia.org/wikipedia/commons/thumb/1/1e/Wave_characteristics.svg/2000px-Wave_characteristics.svg.png

Summary

Sounds are formed by the vibration of molecules in a medium. It carries energy and travels in sound waves. When you hear sounds, the reason why they all sound different is because of wavelength, amplitude, and frequencies. Wavelength is the distance from the top of one wave to another or how wide the waves are. Amplitude is the height of the wave. Frequencies are the number of wavelengths that travel past one point in one second. The frequency of a sound directly affects the pitch of the sound. Lower frequencies have a lower pitch while higher frequencies have a higher pitch.

SP2: Developing and Using Models

I developed models when I experimented with bottles and water to produce sounds of different pitches. By adjusting the amounts of water in each bottle and blowing on them, I was able to learn that bottles with less water have a lower pitch when you blow and bottles with more water have a higher pitch. Using the bottles helped me learn more about sound vibrations and how frequency affects pitch.

XCC: Structure and Function

In order to be able to hear sounds, our ears are specially built and include certain parts. Sound waves enter through the outer ear and travel through the ear canal. Once it reaches the eardrum, the sound waves cause the eardrum to vibrate which moves the tiny bones in the middle ear. The purpose of the tiny bones are to help sound travel into the inner ear where they enter the cochlea (a curled tube in the inner ear that is filled with liquid) and produce waves. Along the exterior of the cochlea are tiny cells that are covered in even tinier hairs. The vibrations of the sound cause the hairs to move sending nerve signals to the brain. The brain processes the nerve signals as sound so you can hear it. Without any of these parts, you wouldn't be able to hear. For example, when the hair cells on your cochlea die or are damaged, that's when you begin to experience loss of hearing.


Sunday, February 18, 2018

Roller coaster Project 2/18/18

Our Roller Coaster


Summary
This past week, our group was tasked with the challenge of creating a roller coaster using a base, tubing, tape, dowels, and cardboard. In addition to this, we had to stay within a budget and purchase all of our materials. In order to create a roller coaster, you must understand Newtons 3 laws of physics as well as have a basic understanding of motion. Creating our track took lots of trial and error. The angle of the tube combined with the acceleration and velocity of the marble were very important factors in ensuring the success of our track. Often, little movements in the tubing would cause out whole track to fail. In order to complete this project, we had to have patience and the ability to think of new ways to support and hold up the roller coaster.


Backwards-Looking: What problems did you encounter while working on this piece?
While working on this project, we encountered many problems especially during the building phase of the track. Often, we would struggle to find the perfect position for the tubing. For example, in the second half part of our track, it involved a hill where the marble could accelerate to accumulate the speed needed to clear the next loop. Finding a happy medium between having a marble going so fast it falls out of the track and a marble going to slow it falls out of the loop took some time. Combined with angle positions, placing the tubing in the perfect position took lots of trial and error. Sometimes, even, the track would work perfectly one time and fail the next. Making it consistent was the hardest part of the project.


Inwards-Looking: What was especially satisfying to you about either the process or the finished product?
Due to how much of struggle it was to create our roller coaster track once we completed it, it was especially satisfying. It took way too much time for our group to finish construction since the marble was never consistent in the way that it traveled. However, despite this, I like how it turned out and think that the design of the track is pretty cool thanks to all of its loops, drops, and turns. It is fun to watch as well as was fun to build.


Outwards-Looking: What do your classmates particularly notice about your piece when they look at it?
One negative thing a classmate may notice when looking at our roller coaster is that it is kind of plain and messy as far as construction goes. The dowels are held up with rough cut pieces of cardboard and wads of tape, making it not very attractive. However, they may also notice that our roller coaster's design is really loopy and interesting. Making all of the loops was hard to do since the marble would constantly fall out of it so that is one part of the track I am proud of.


Forwards-Looking: What's the one thing that you have seen in your classmates' work or process that you would like to try in your next piece?
When looking around the classroom at other group's roller coasters, I noticed one group had really nice decorations. They covered the dowels and cardboard pieces in paint and tons of decorations made out of pipe cleaners. The roller coaster looked much more neat and nicer than ours did. When working on another construction type project, I will make sure to set more time aside so I can spend more time on the appearance and attractiveness of our product.

Sunday, February 4, 2018

Weekly Blog 2/4/18 - Energy

https://i.ytimg.com/vi/C1w_-hL6mag/hqdefault.jpg

Summary

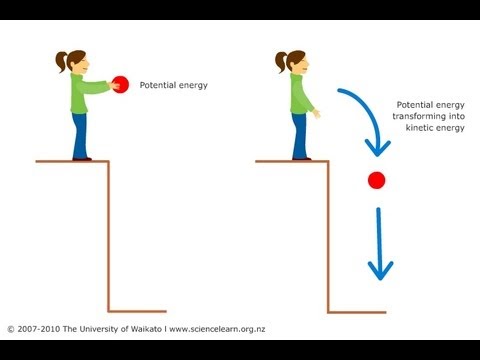
Energy is the ability to do "work". It is measured in something called joules. One joule is equal to the force of one newton acting through a distance of one meter. Kinetic energy is energy an object has due to its motion. For example, if a ball is dropping down like shown in the picture. The ball is in motion and the energy is kinetic. Potential energy is energy that is being stored and waiting to be used. When an object begins to move, the potential energy stored in that object becomes kinetic energy. There are different kinds of potential energy including gravitational, elastic, and chemical potential energy.


SP4 - Analyzing and interpreting data

I analyzed data when I completed several online interactives that taught me about newtons laws as well as energy. While completing the games and activities, I collected and recored the data I found in a graph on either a paper or google document. Once I completed the tables, I interpreted the data and made conclusions on my findings. In one game, I collected data on the amount of energy produced based on the speed an object is being launched at and its mass. After creating a table, I analyzed it and saw that the higher the speed and mass of an object, the higher amounts of energy would be produced.


XCC: Energy and Matter

When you are throwing an object, the speed of the launch and mass of the object will directly affect the amount of energy produced. If you throw the same ball at different speeds, the amount of energy produced will change. The higher the speed the more energy. The same thing happens when you throw different balls with different masses and different amounts of matter at the same speed. The heavier the ball, the more energy produced. This is one example of the relationship and system between mass and matter, speed, and energy.

Sunday, January 28, 2018

Weekly Blog 1/28/18 - Newtons Laws of Motion

7507679046_9ec84d534a_b.jpg

Summary 

Newton's first law of motion is the law of inertia. This law states that an object with no force applied to it will never move and when force is applied to an object, it will stay in motion as long as no outside forces cause it to stop. Newton' second law states that force is equal to mass x acceleration (f = ma). But what exactly is acceleration? Acceleration is when you are either speeding up, slowing down, or changing direction. This means that even if you are just standing still and turning in a circle, you are still accelerating. Newton's third law states that for every action there is an equal and opposite reaction. 


SP 5: Using Mathematics and Computational Thinking

While conducting several experiments on finding the speed and velocity of different cars I had to use lots of math. For example, to calculate the velocity of one of the cars I had to use certain mathematical skills like division and addition to find averages. Using the formula speed = distance/time, I was able to calculate the speed and velocity of all of the cars. Once I had completed that portion of the experiment and collect all of my data in tables I created line graphs to represent my data. 


XCC: Cause and Effect

All of Newton's laws of motion have to do with cause and effect. For example, the law of inertia states how you need to apply a certain amount of force to an object in order to get it moving. This is cause and effect. One way to think about it is if you are biking. On a mountain or road bike, you can shift gears to control the amount of force needed to pedal making you go faster or slower. When you are on a low gear, it takes more force to pedal and set the bike in motion because there is more weight against you. The cause is the force you apply against the pedals and the effect is the motion and movement of the wheels. In addition to this, Newtons third law of motion is also all about cause and effect. In Newton's third law, every action has an equal opposite reaction, the action is the cause while the reaction is the effect.

Sunday, January 21, 2018

Weekly Blog 1/21/18 - Speed

https://encrypted-tbn0.gstatic.com/images?q=tbn:ANd9GcR3aeI69P0_NR5f129JxrUxKDCdOzUHtKE2Rr-
VwIZbc9MZ8RTh


Summary

The formula for finding speed is distance/time. In other words, speed is simply how fast you are going. It is a scalar quantity meaning it only measures magnitude. An example of speed is 31 mph. Velocity, on the other hand, measures speed with direction. It is a vector quantity. Knowing the velocity of objects is very important. We use our knowledge of speed and direction in our everyday life like when you are in a car, turning and driving around the road when you are crossing the street, and more. To keep track of speed and velocity, you can represent them in a graph. You can do this with either a distance-time graph or a speed-time graph.


S&EP 3 - Planning and Carrying Out Investigations

I planned and carried out an investigation when I completed a lab testing out and comparing the speeds of three different cars on a ramp. I first had to identify the controlled variables on a worksheet such as the height of the ramp, material of the ramp, slope, and the length of the track. The variable being manipulated was the car since we took turns sending different cars down the ramp to test their speeds. Once we set up the ramp, I made my hypothesis. My hypothesis was that the green car would travel the fastest and take the least amount of time to get to the end since it was the heaviest. After testing and timing all of the cars and recording my data on a chart, I found that my hypothesis was correct.


XCC: Structure and Function

To record your data and represent motion, you can create a distance-time graph. The function for a distance-time graph would obviously be distance/time which will give you speed. These graphs help you see how long it took for an object to travel a certain distance. The structure of these graphs are the distance plotted on the y-axis and time on the x-axis. It is really important to get the structure of the graph down and the axis' marked and written correctly. For example, if you recorded speed on the y-axis instead of distance on the y-axis the function of the graph would completely change. Now, the graph tells you how fast an object is moving for how long. That would be a speed graph.


Sunday, January 14, 2018

Weekly Blog 1/14/18 - Speed, Motion, and Velocity

https://c1.staticflickr.com/4/3184/2495892146_af8b878200_b.jpg

Summary

Scalar quantities only measure the magnitude of objects while vector quantities measure both the magnitude and direction. An example of a scalar quantity would be a distance while a vector quantity would be displacement. People often get distance and displacement confused. Distance is the total amount of distance you traveled/moved while displacement is the amount of distance between your start and end point. Another example of scalar vs vector quantities would be speed and velocity. Speed is a scalar quantity while velocity is a vector. In addition to all of this, regarding motion, to determine whether or not something is in motion you use reference points. A reference point is an object used in comparison to another object to determine whether or not that object is in motion.

SP2: Developing and Using Models

I developed and used models to determine and represent the distance and displacement of objects. By using simple math and sometimes the pythagorean theorem, I was able to draw models on graph paper and in formative that represented the direction and distance objects traveled. The models helped me visualize the movement of the object by creating a visual representation of the object's distance and displacement. I also used models when I analyzed and learned about distance over time graphs. I used the graphs to visualize and see the speed an object, distance traveled, and time spent traveling. 


XCC: Stabillity and Change

In distance over time graphs, you are able to observe when the speed of the object is stable, and when it is changing. You can observe this by looking at the slope of the line. When the object is moving at a steady pace, the line will be linear or straight. The higher the slope, the faster the object is moving. In a formative, I analyzed the movement of Tom by looking at a graph and determining the stability and change within his speed and travel distance. The graph was able to tell me how fast he was moving, how long it took him, how far he traveled in what direction, and when he was stable or not.